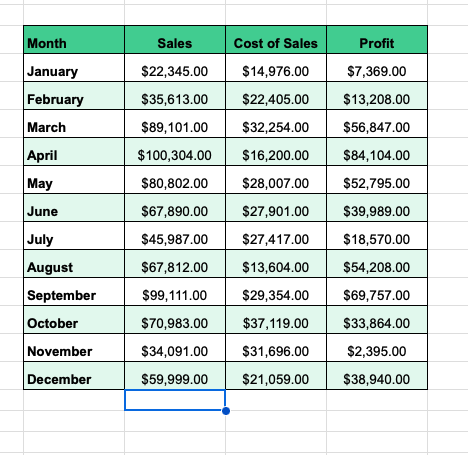
A Line graph in a cell!
A very simple way to make any projections, financial data or general data look super professional in a few easy steps.
You can download our working example sheet here
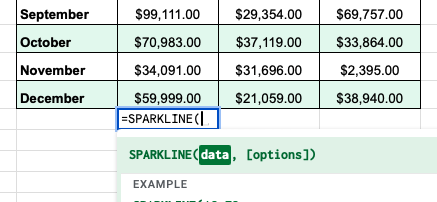
Step 2: Type in the formula =SPARKLINE(
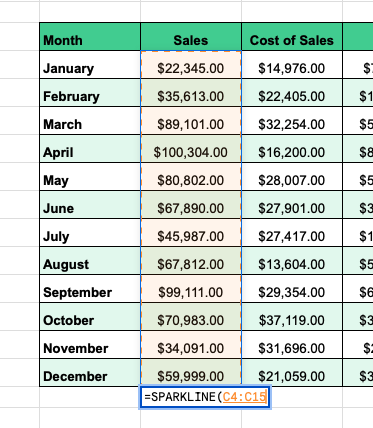
Step 3: After the opening bracket, drag and select the cells you wish to reflect in your sparkline!
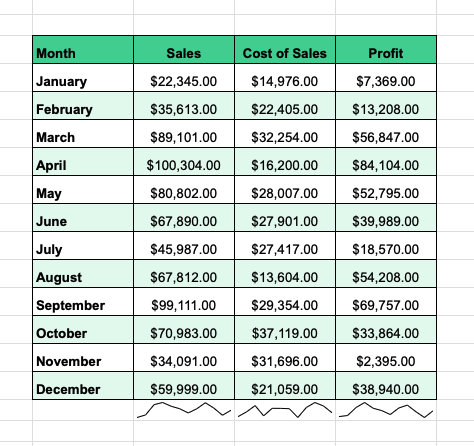
Step 4: Click Enter
And there you go! Sparklines. An easy way to add fancy looking line graphs into your Google Sheets without enabling the charts function just yet.
Need more Google Sheets tips? Join our FREE Discord!